
Imagine you’re stood on the bank of a river. Financial freedom is on the other side. The person next to you tells you that the river is four feet deep.
Would you cross the river?
What if the person next to you says the river is on average four feet deep? Some parts are six feet deep, and at times your feet are barely wet. Financial freedom still awaits you.
Would you still cross the river?
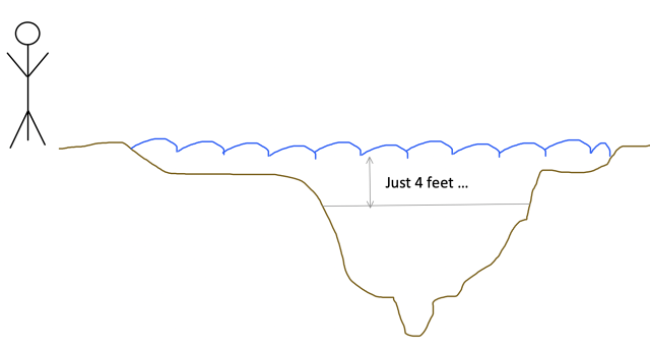
It’s a different thought process and this is exactly what happens with investment returns.
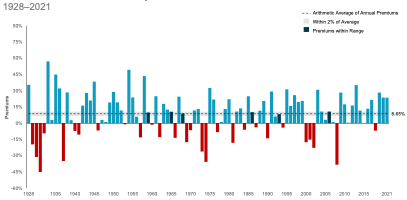
Markets go up and down daily so a return averaged over 10 years can be misleading. The chart below shows the return of the American stock market each year since 1928. The average return was 8.65% p.a. but the yearly return was close to that only 6 times in 93 years.
It’s a similar story with the UK market.
This is one of the reasons we never recommend anyone be 100% exposed to the stock market; the returns have historically been higher but it’s a rollercoaster of a ride. You need a comfortable proportion in shares and the rest in bonds and cash that treads a smoother line and, importantly, helps you sleep well.
The other point to take from the chart is the 28 negative years, meaning markets have historically been gone up in 70% of calendar years and fallen in 30% of calendar years.
This is why successful investing requires realistic expectations, patience, and discipline over many years. As Tony Blair almost said, “behaviour, behaviour, behaviour”.
History has always rewarded patient, disciplined investors.
Now you know why: because an average return is not very common and a lot of people struggle with that.
And of course I have to end this by pointing out that past performance is not a guide to future performance.